05
Branding


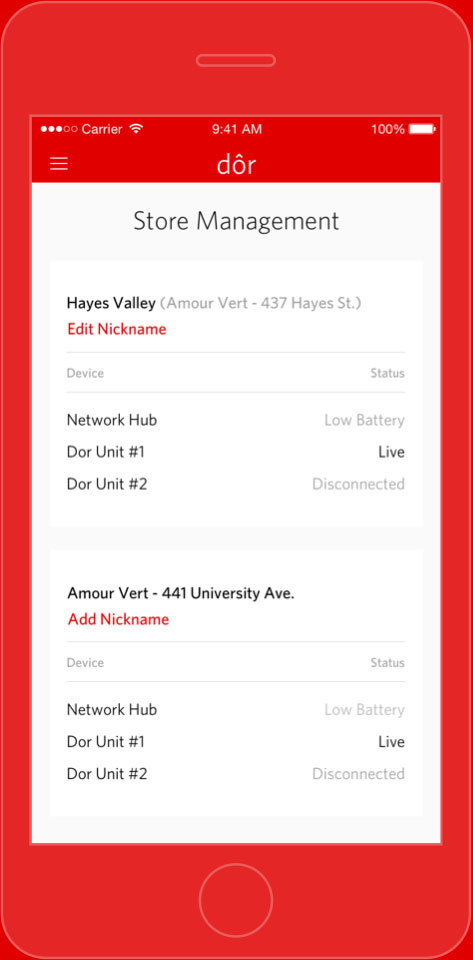
Dor is a retail analytics tool that tracks customer traffic for retail businesses by using a proprietary sensor. Dor correlates customer traffic to other relevant store data, such as POS, weather, and local events, to discover and deliver meaningful insights about the business. Product Site
UX Problems
How can Dor present dense store data as more digestible information?
How can Dor's product page pique the interest of business owners?
How can Dor simplify the difficult buyer journey for retail analytics?
Problem
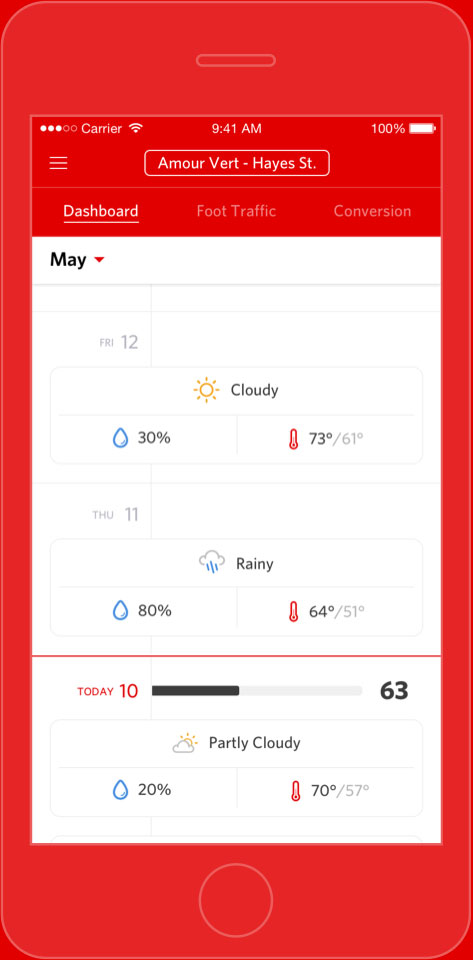
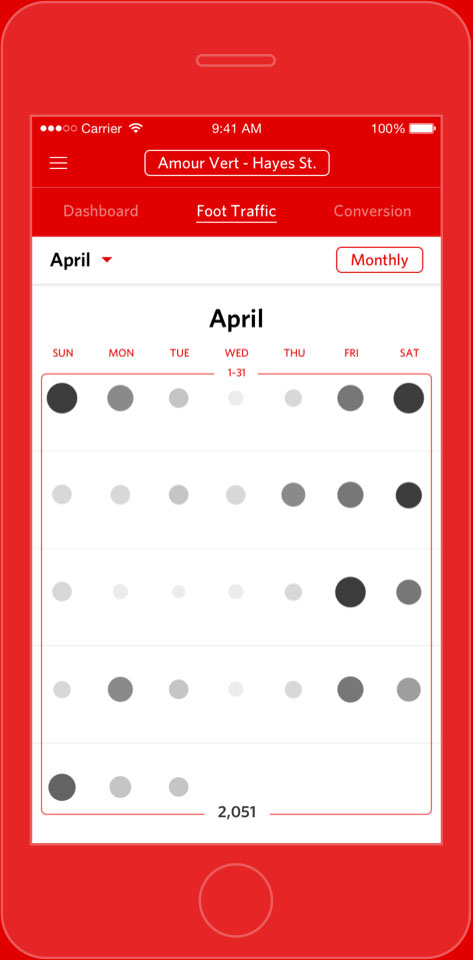
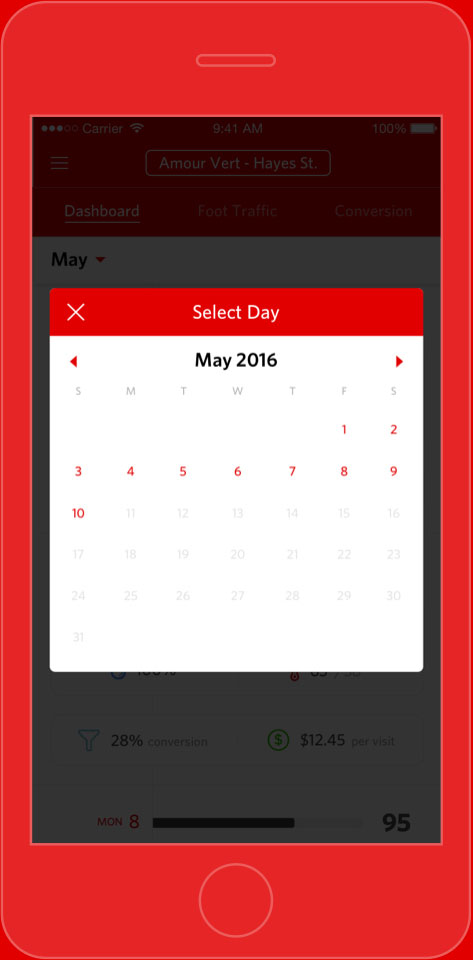
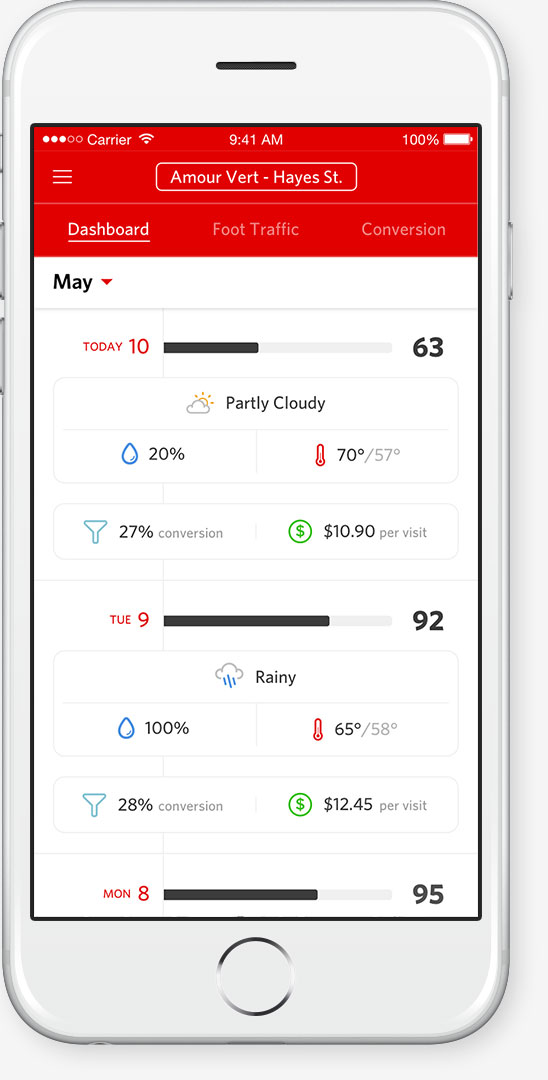
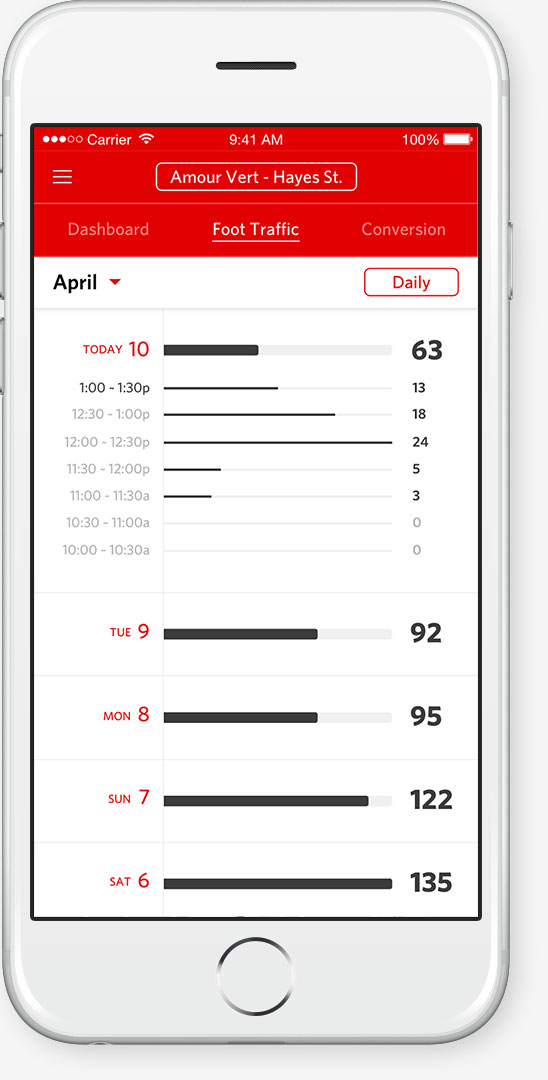
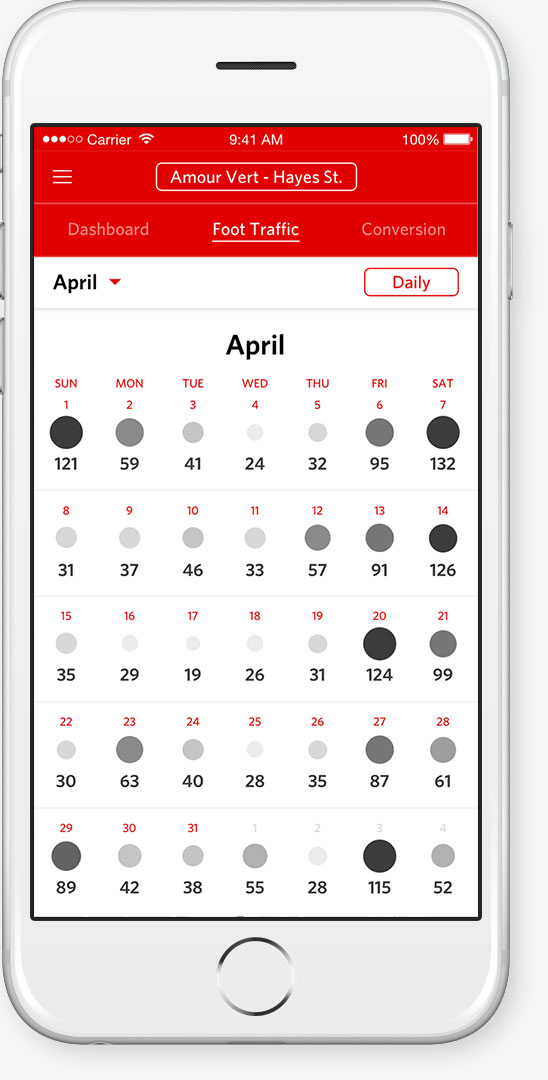
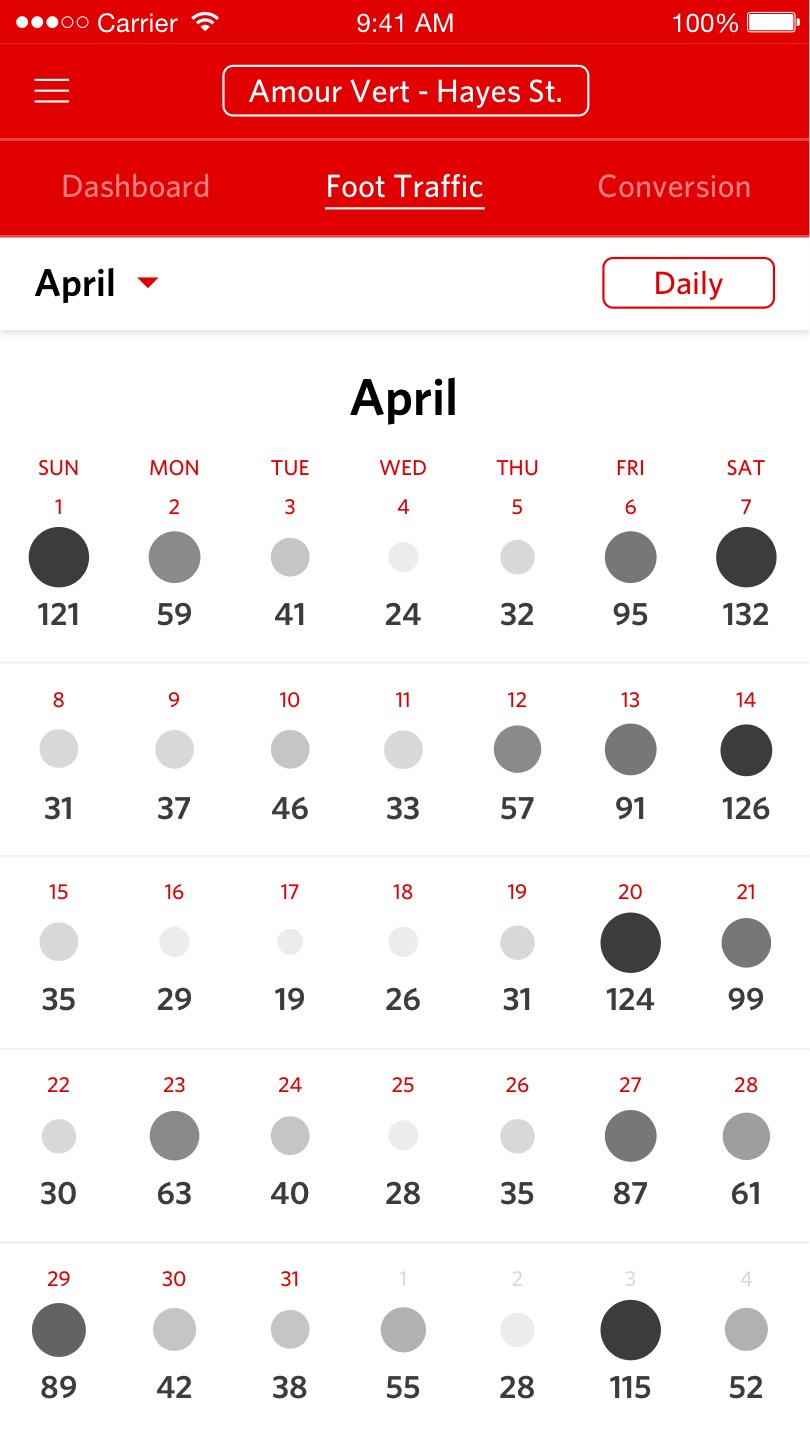
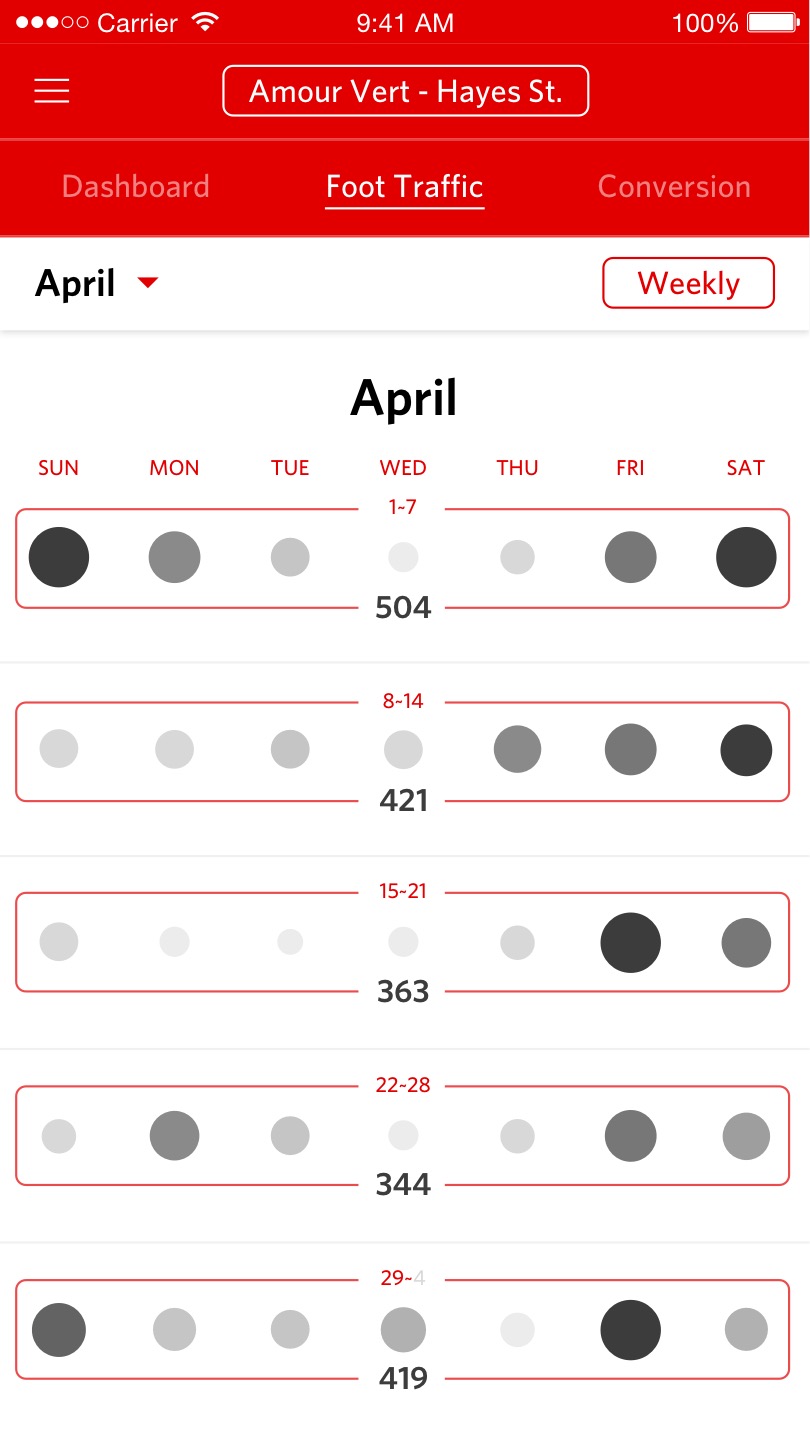
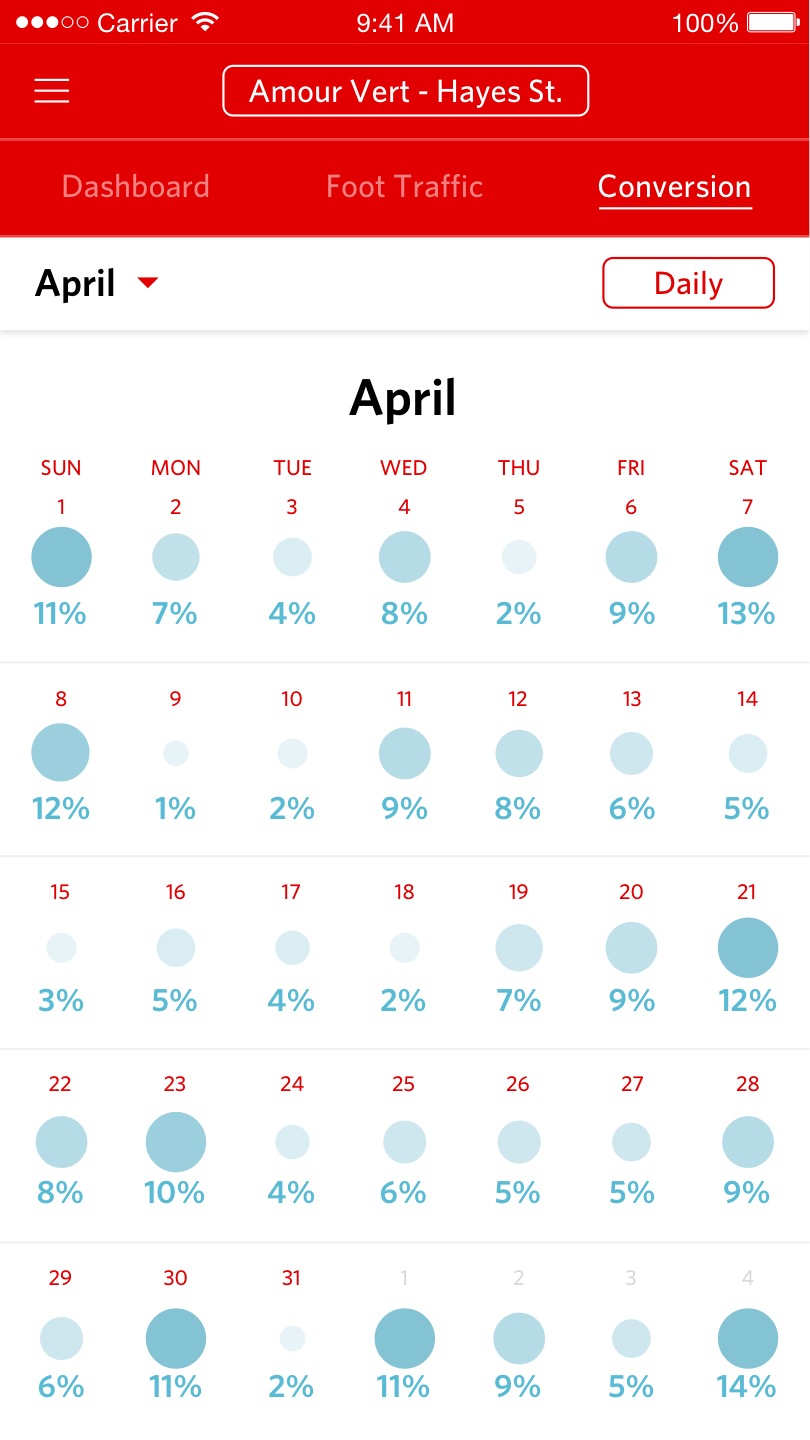
How can Dor present dense store data as more digestible information?
Solution
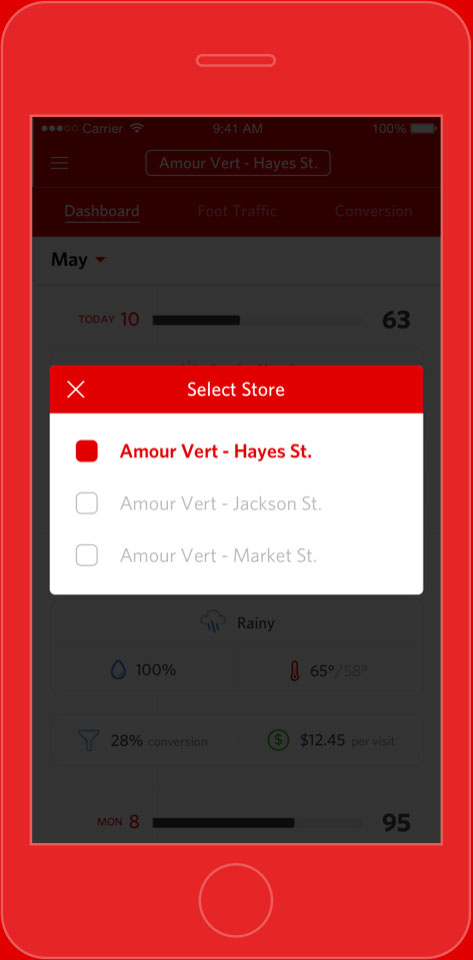
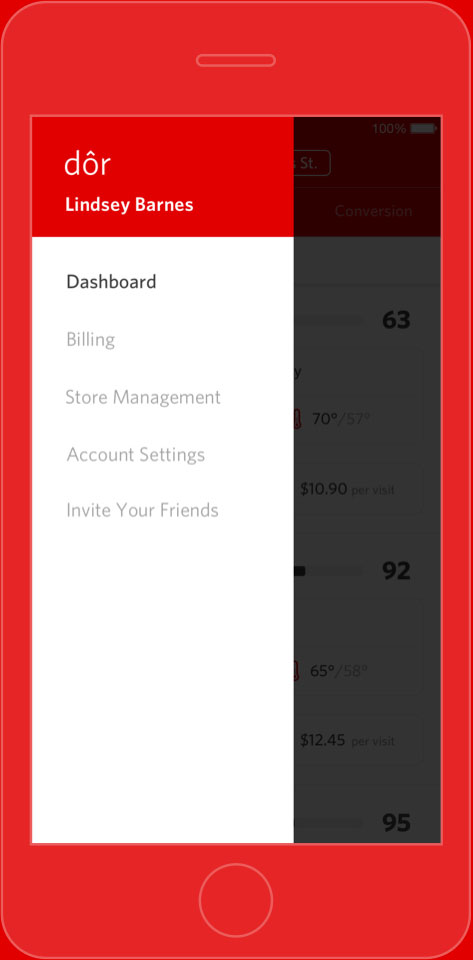
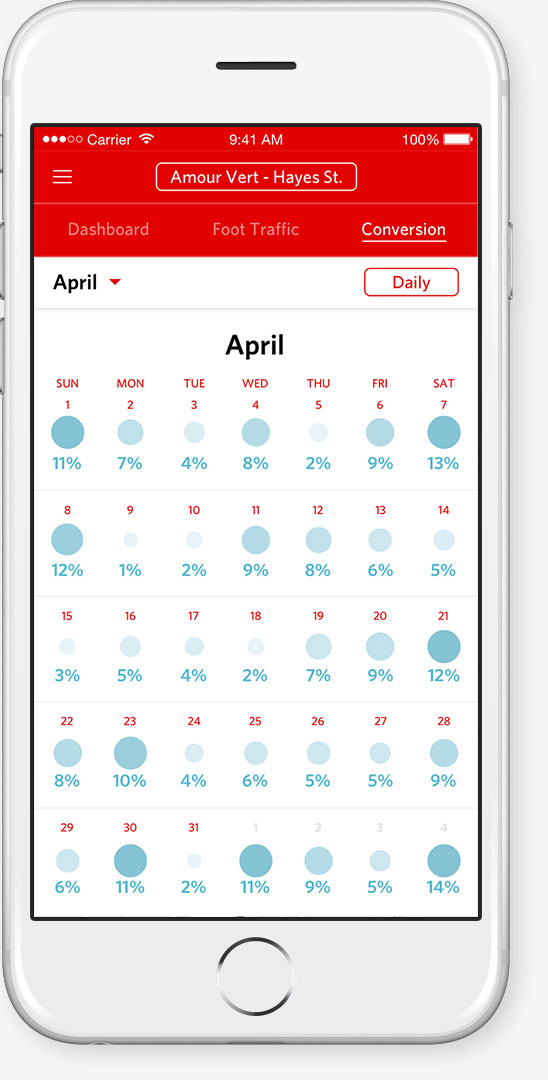
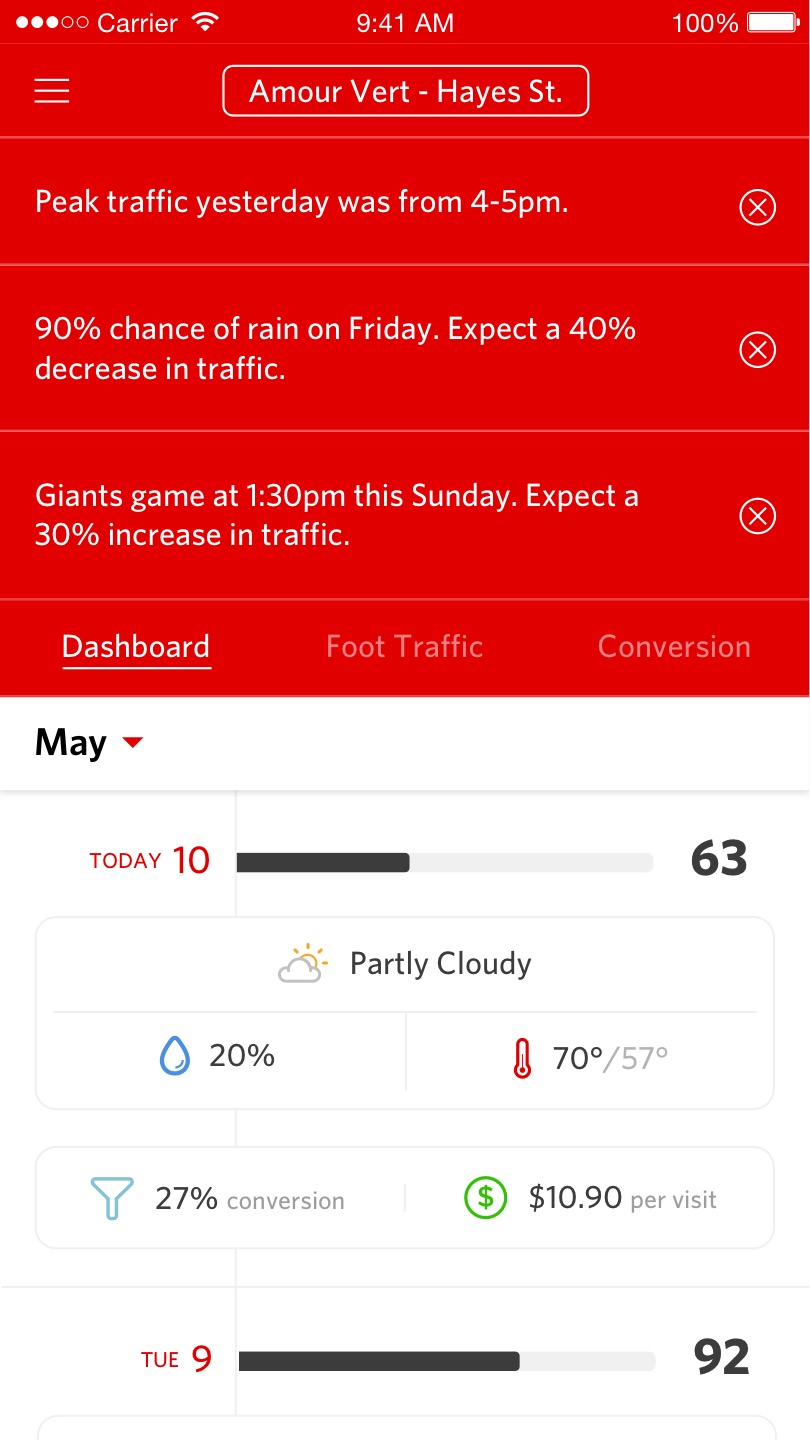
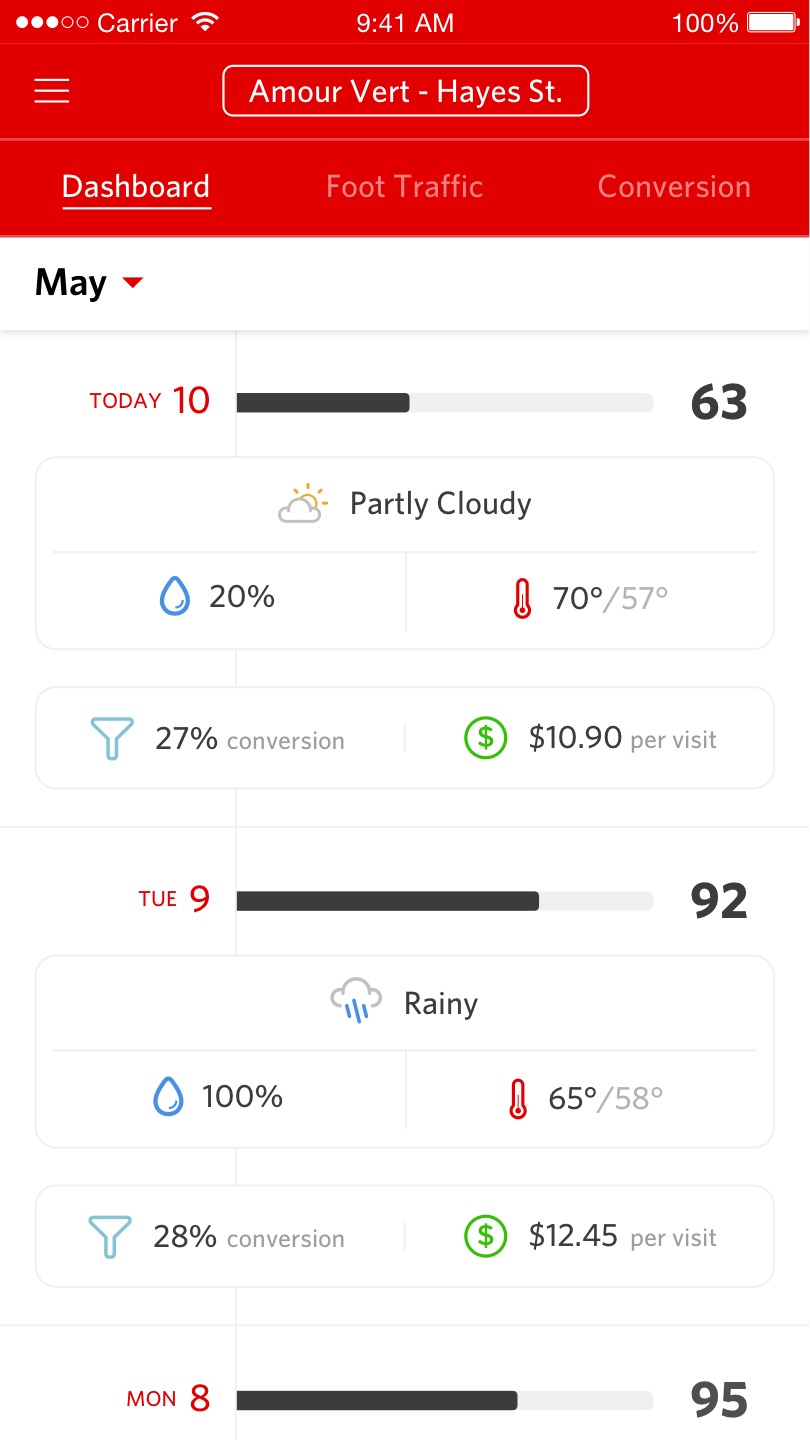
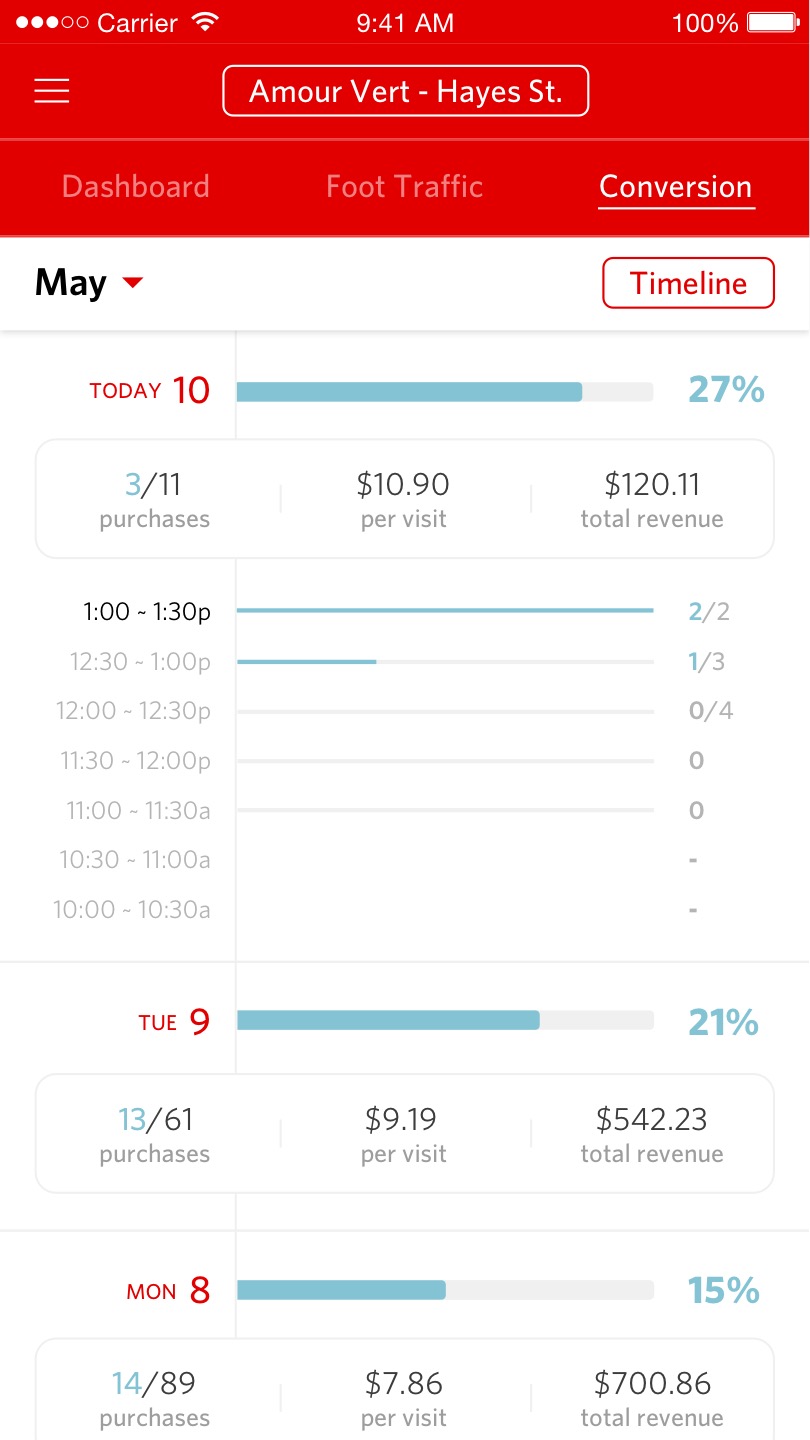
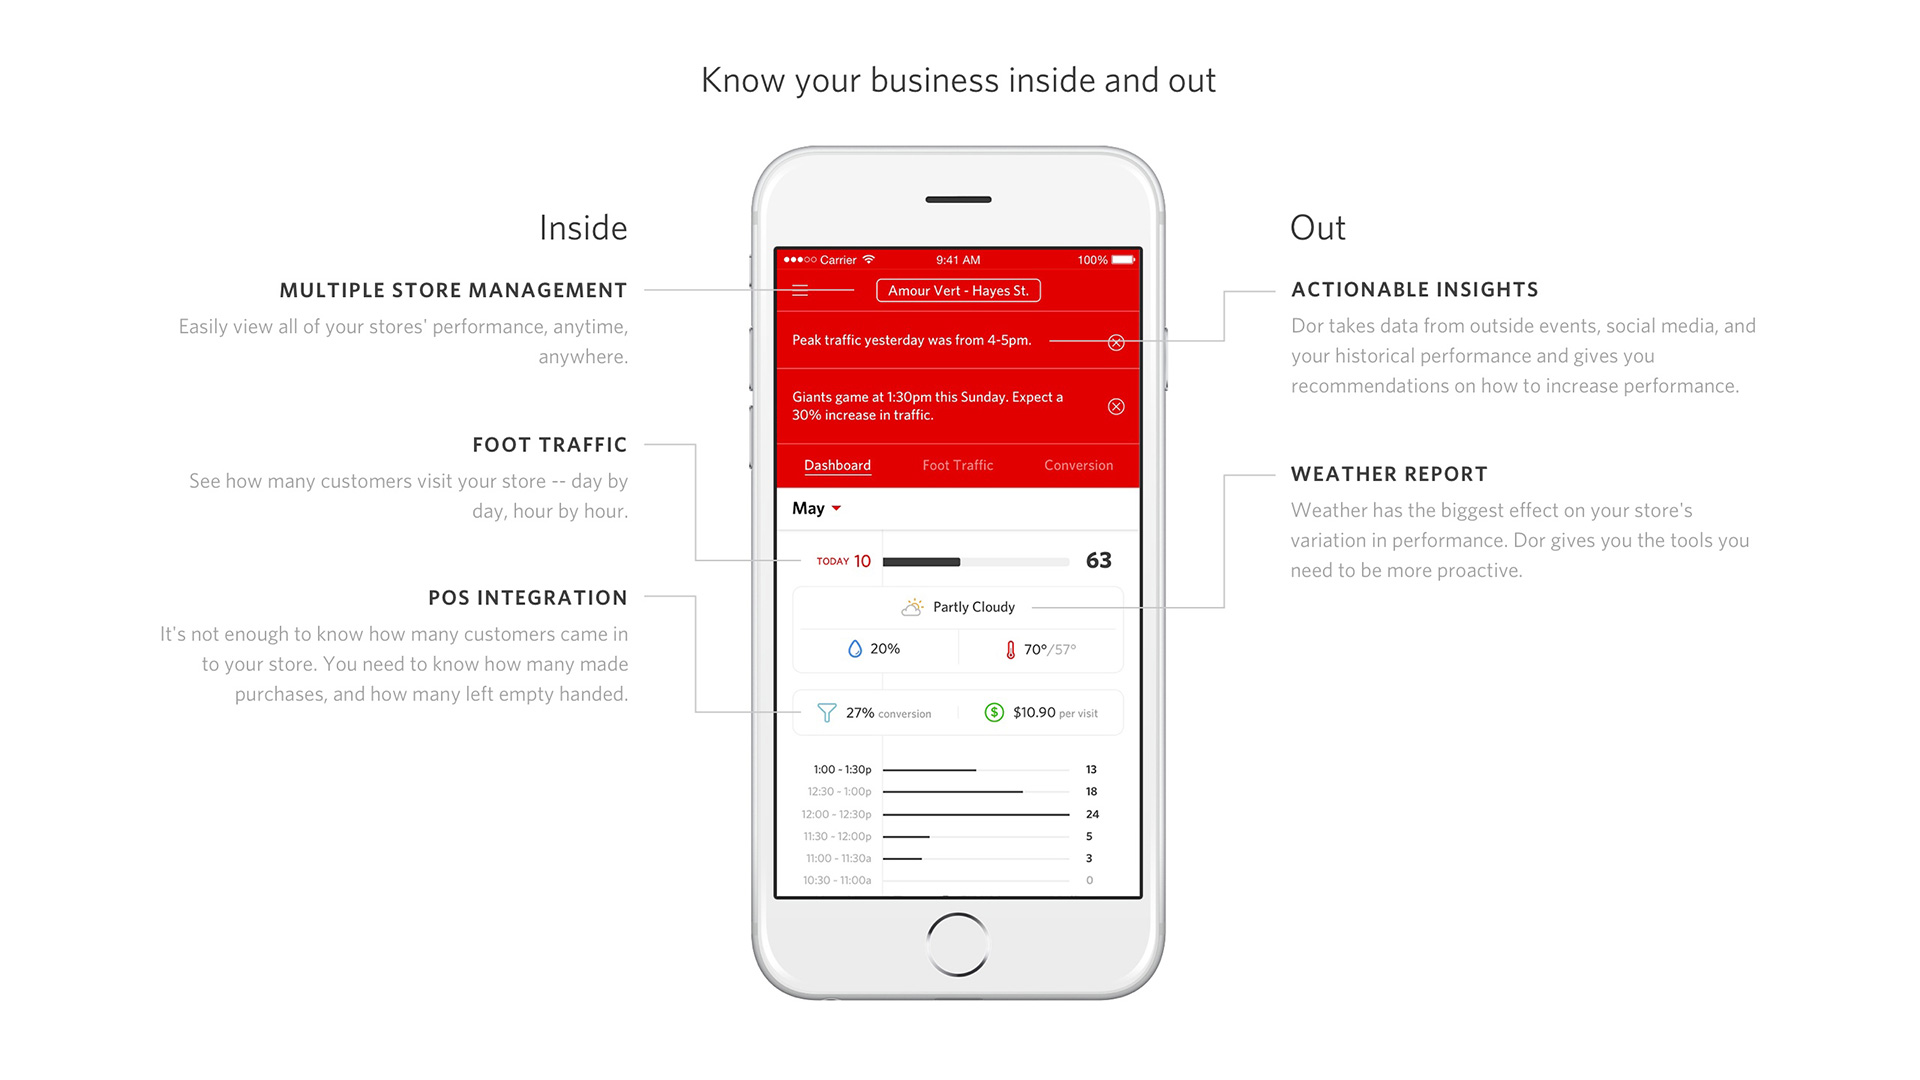
Dor separates each data point into its own tab and visualizes the data on a vertical timeline, which enables users to easily navigate between days and toggle in and out of granular data. Users can also switch to a calendar view to see big picture trends.


Problem
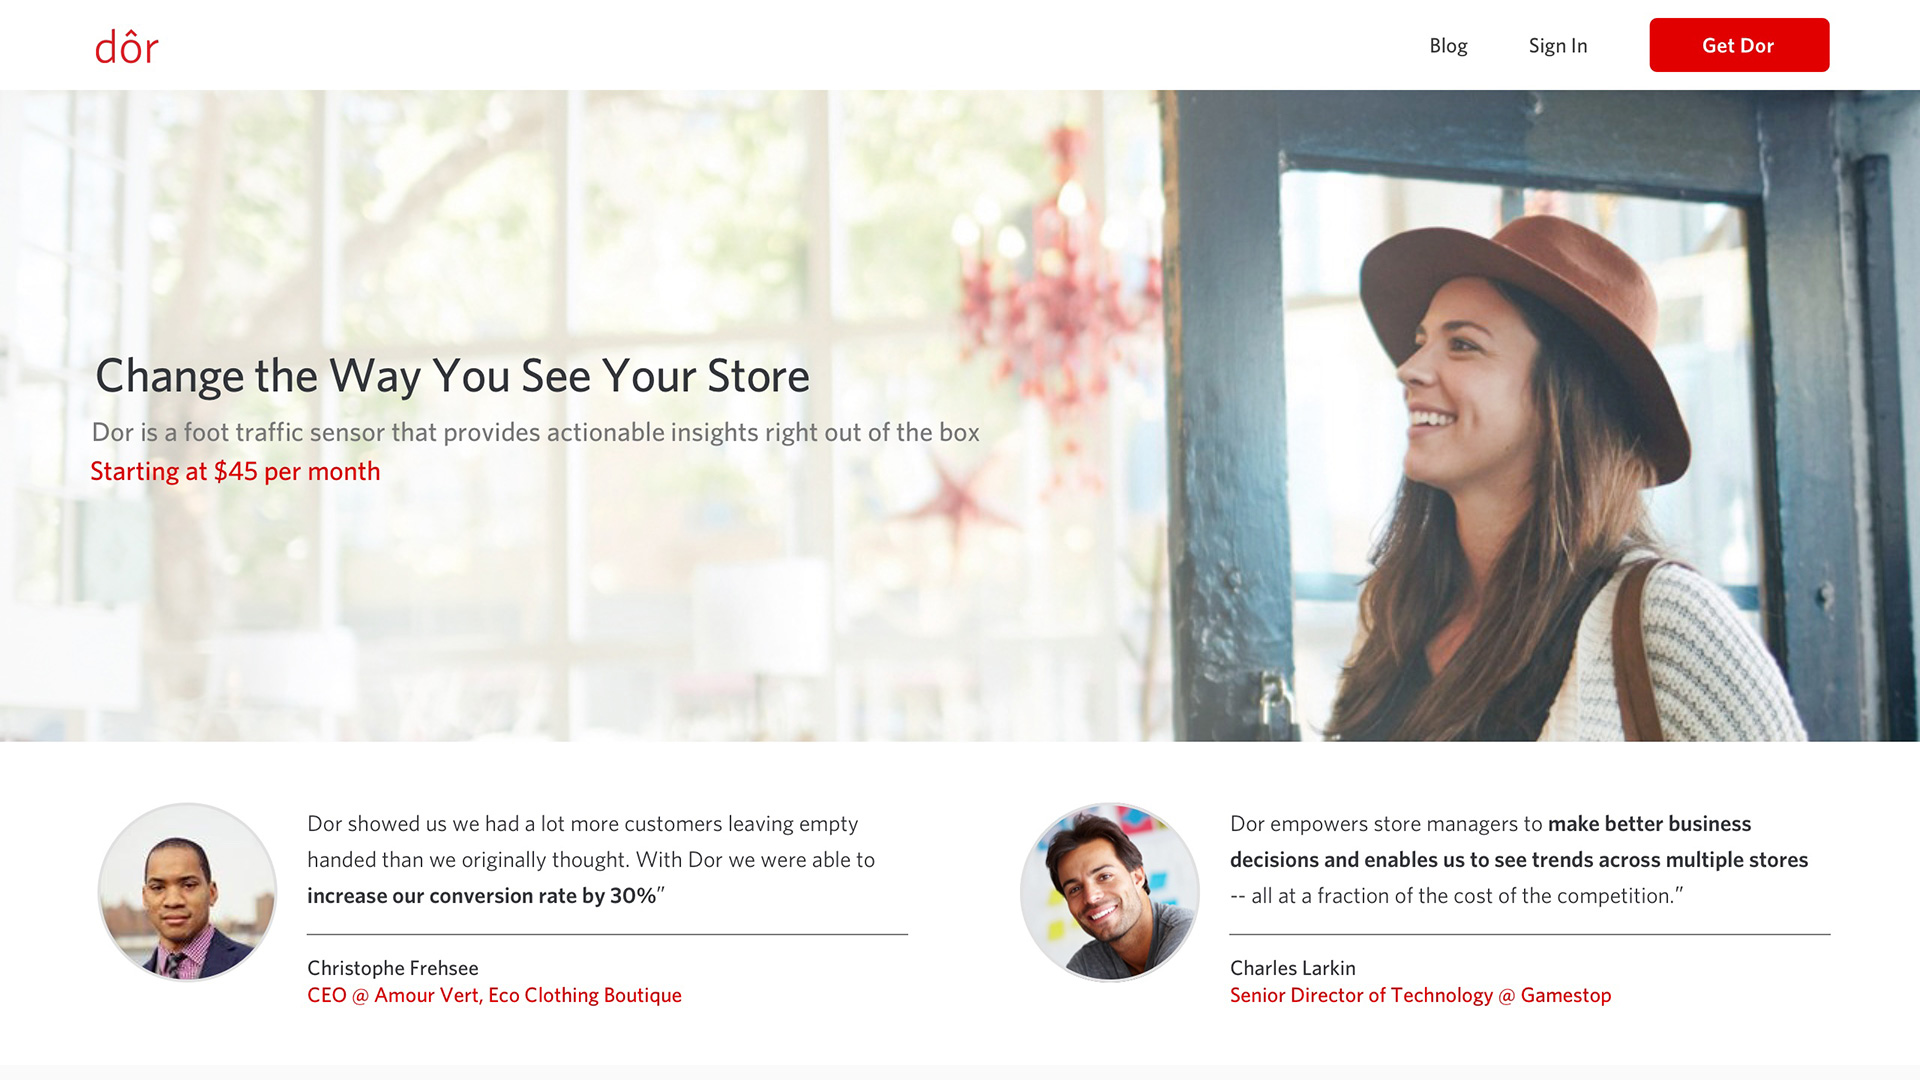
How can Dor's product page pique the interest of business owners?
Solution
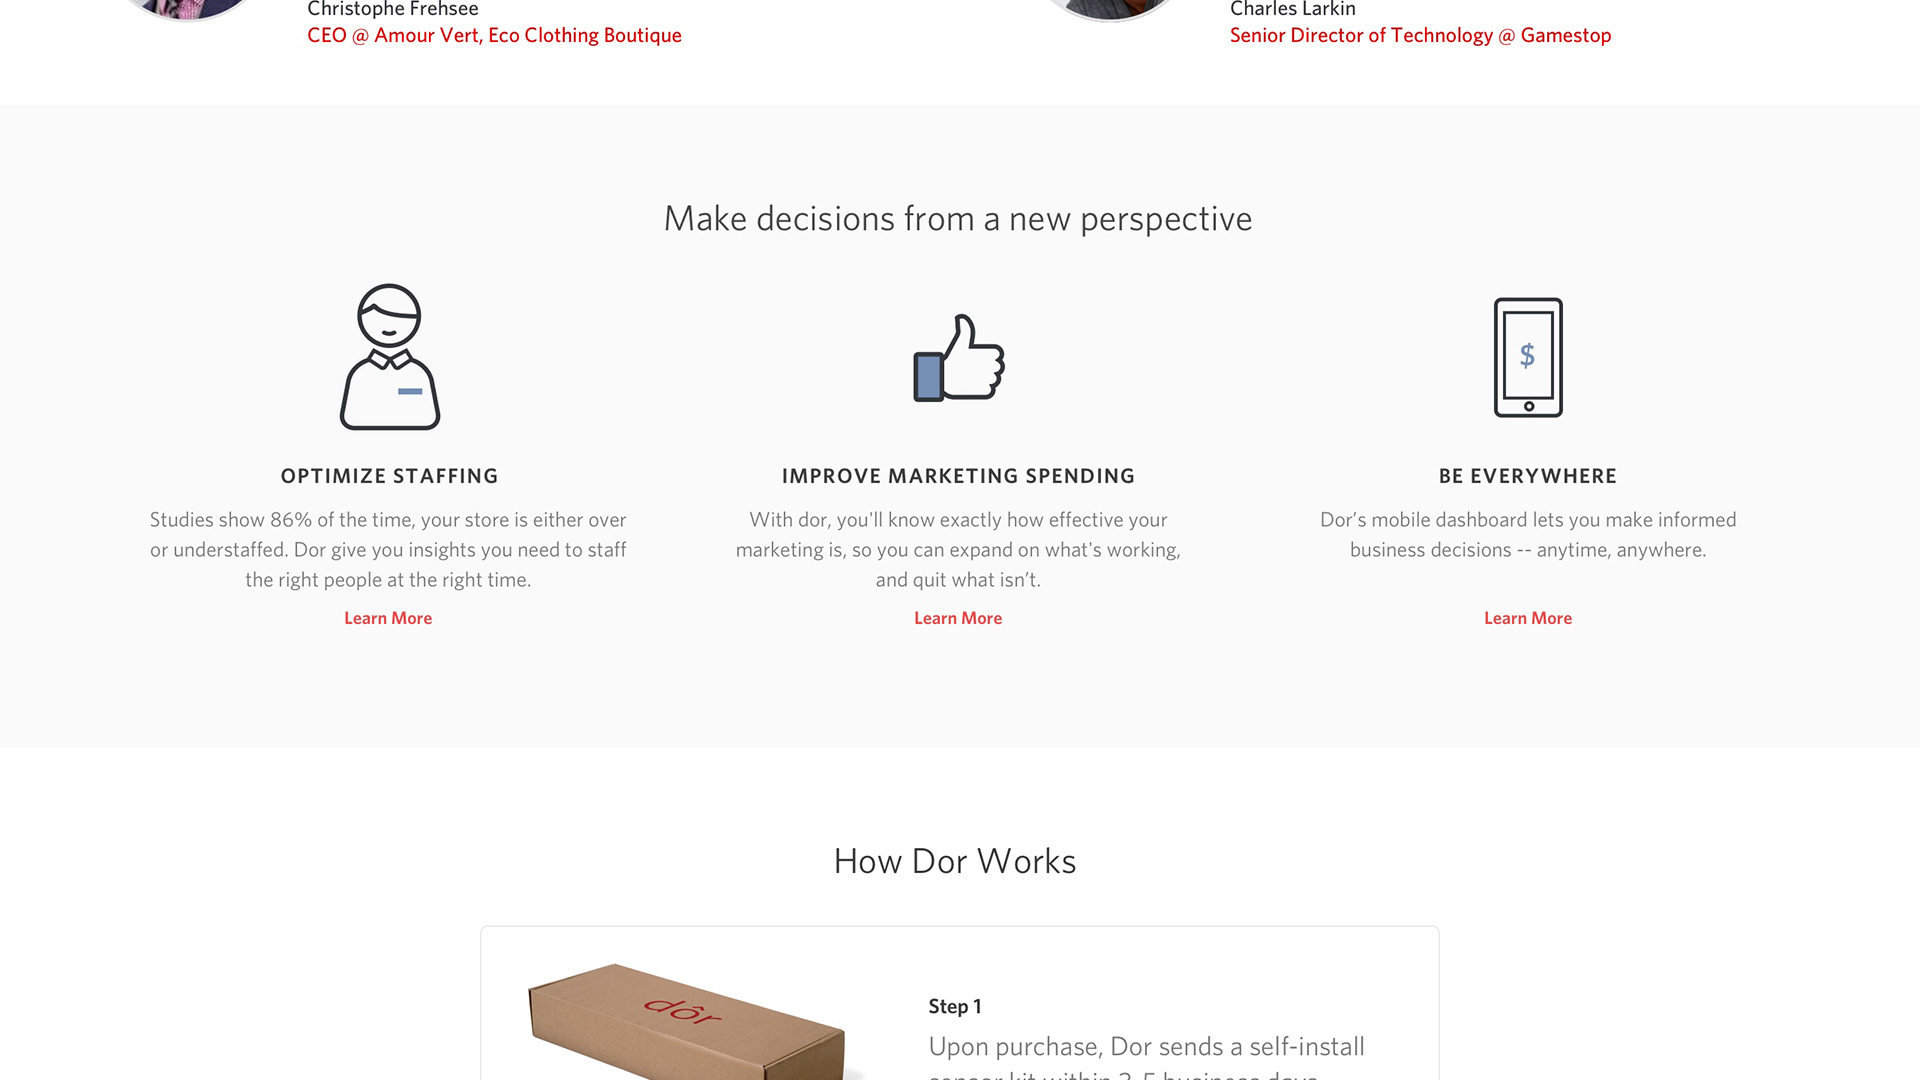
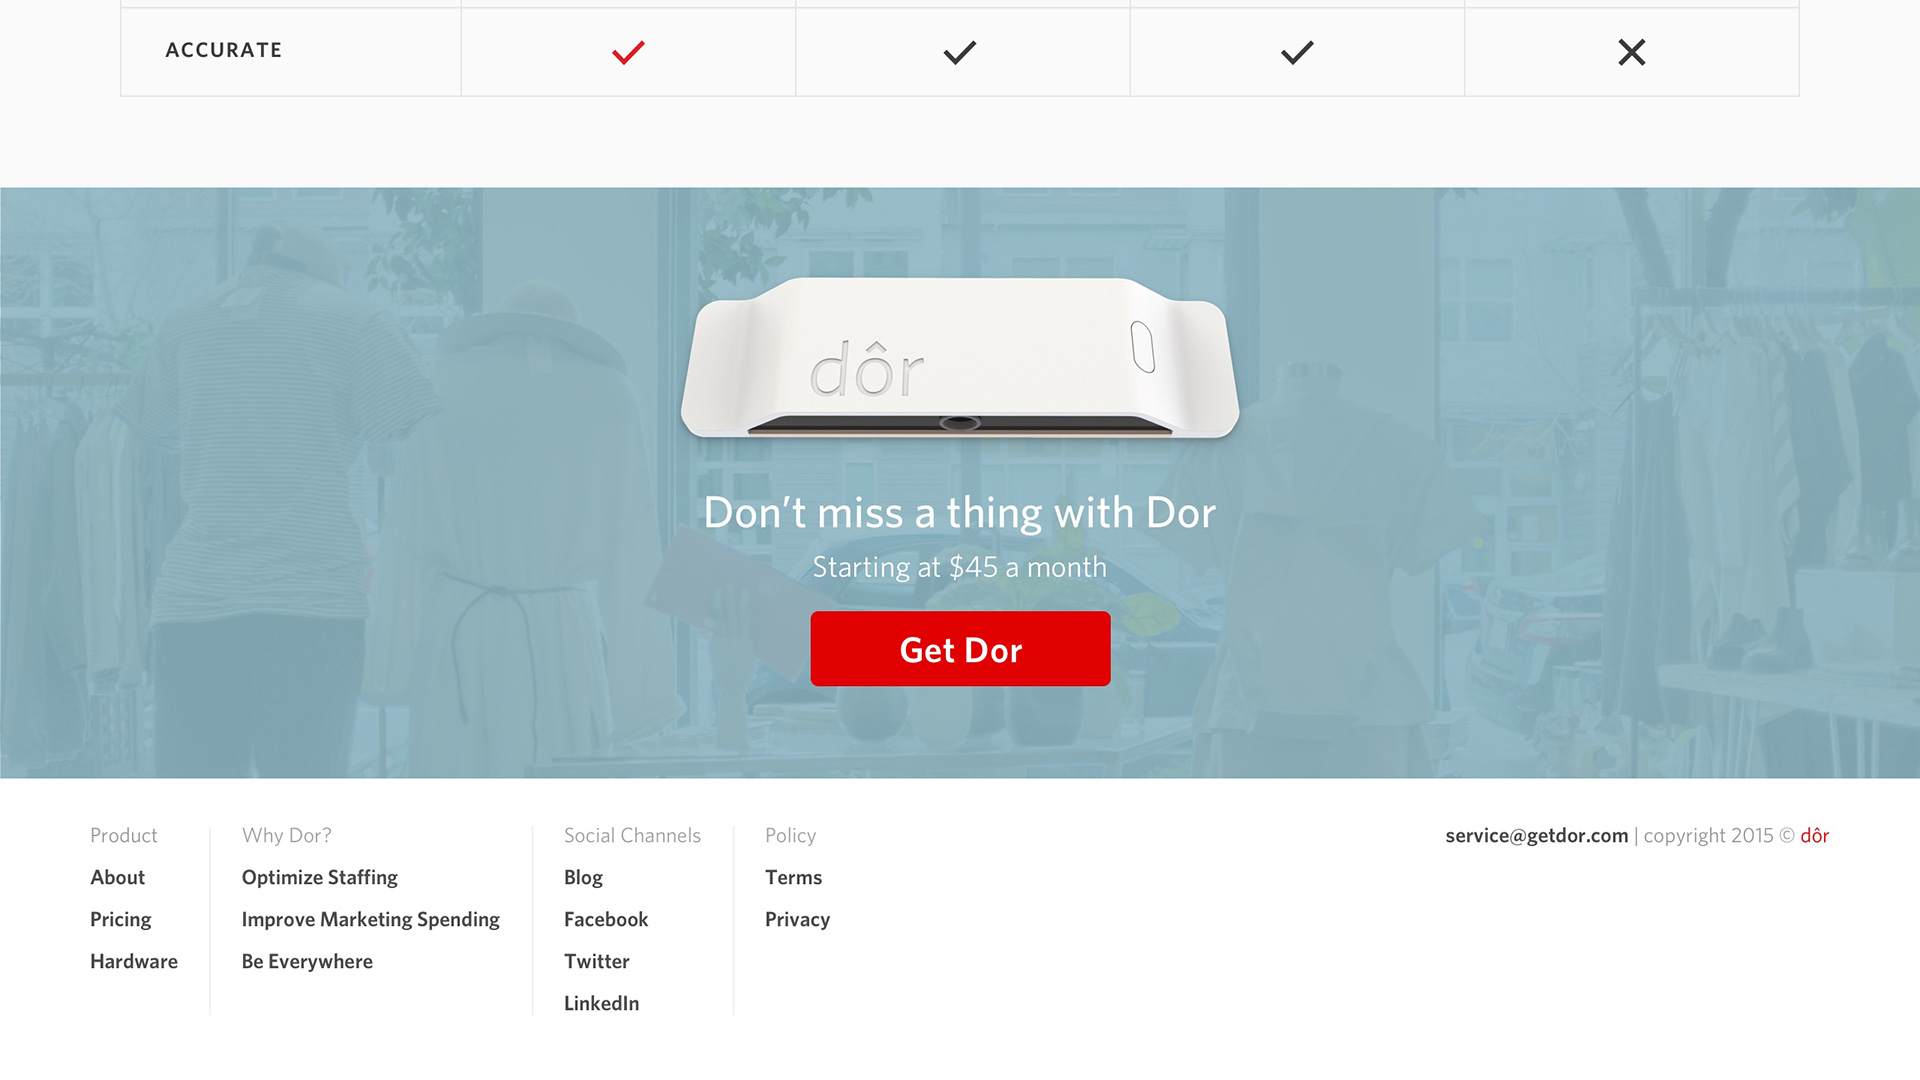
While Dor includes a hardware component, the core of the product lies in the analytics solution. Rather than inducing gear-lust with images of the sensor, Dor's product page is forthright in showing how retail analytics can effectively help businesses.
Problem
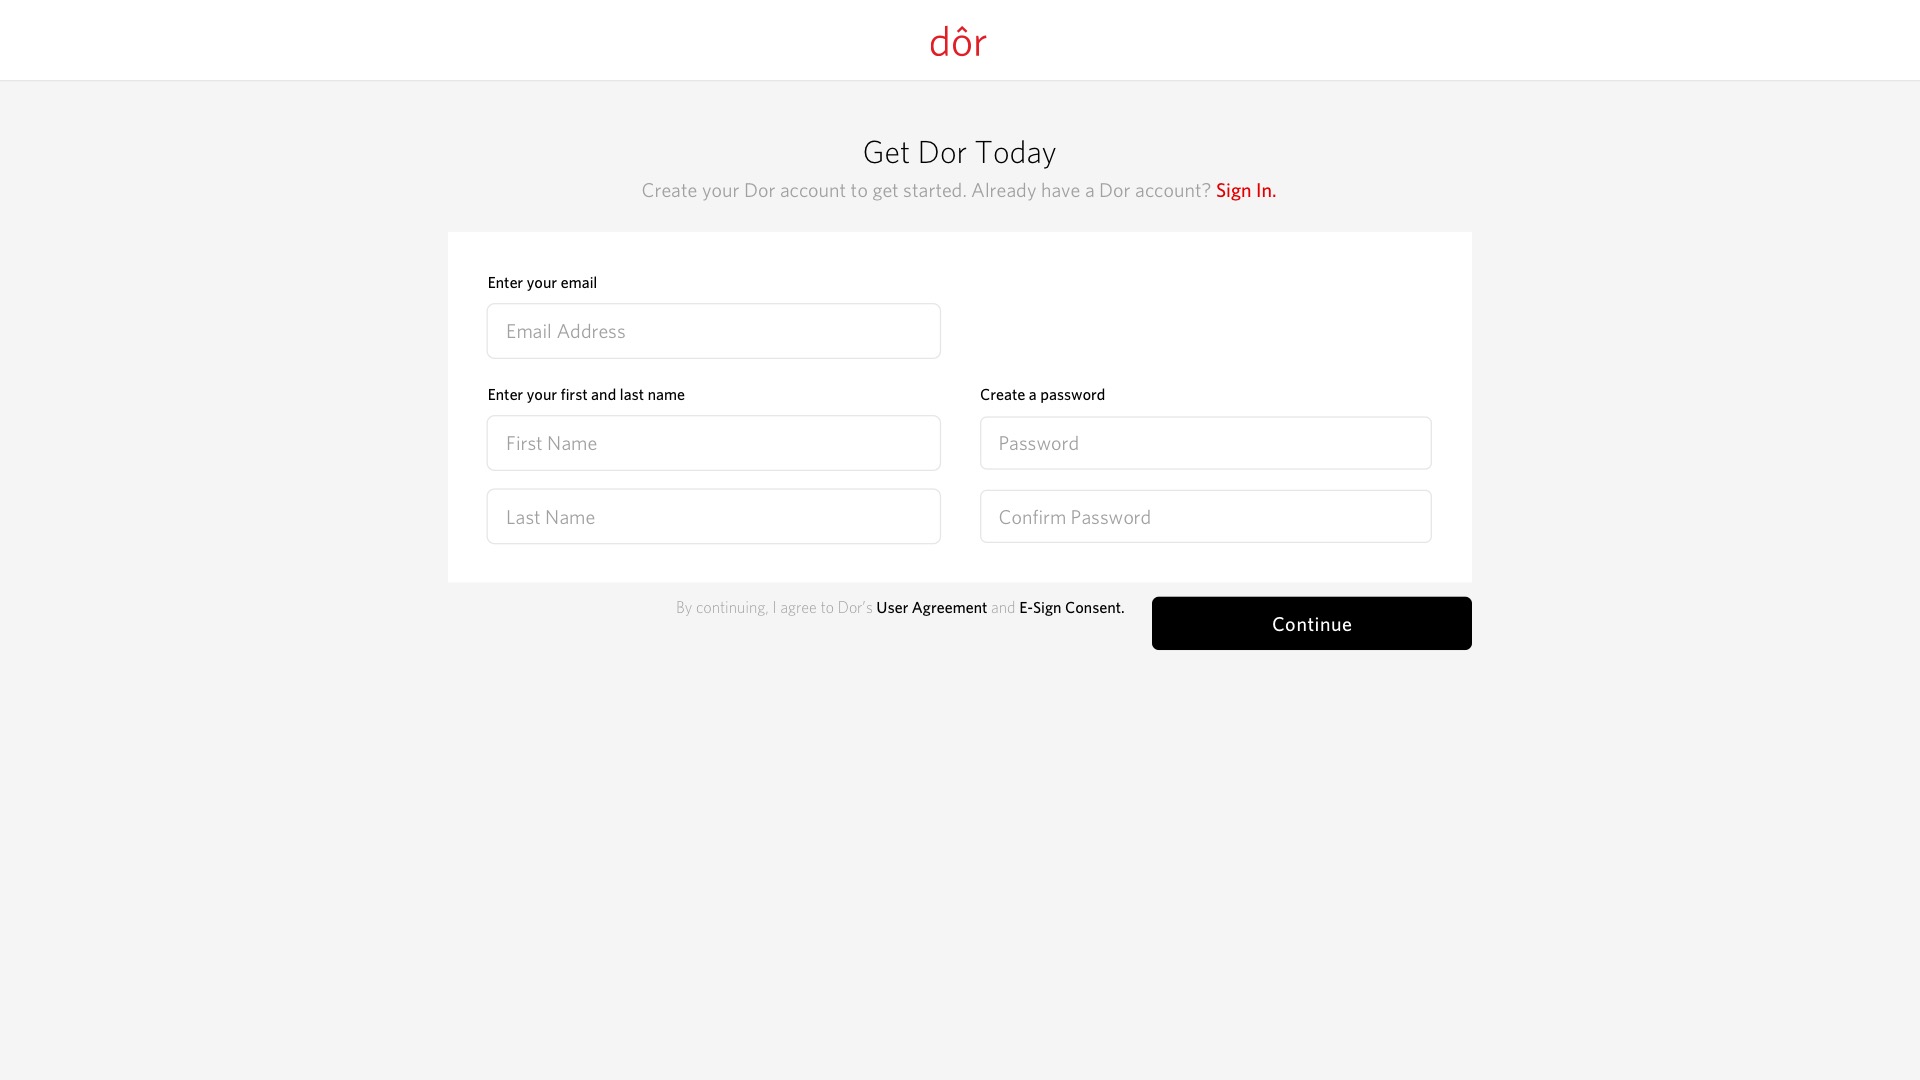
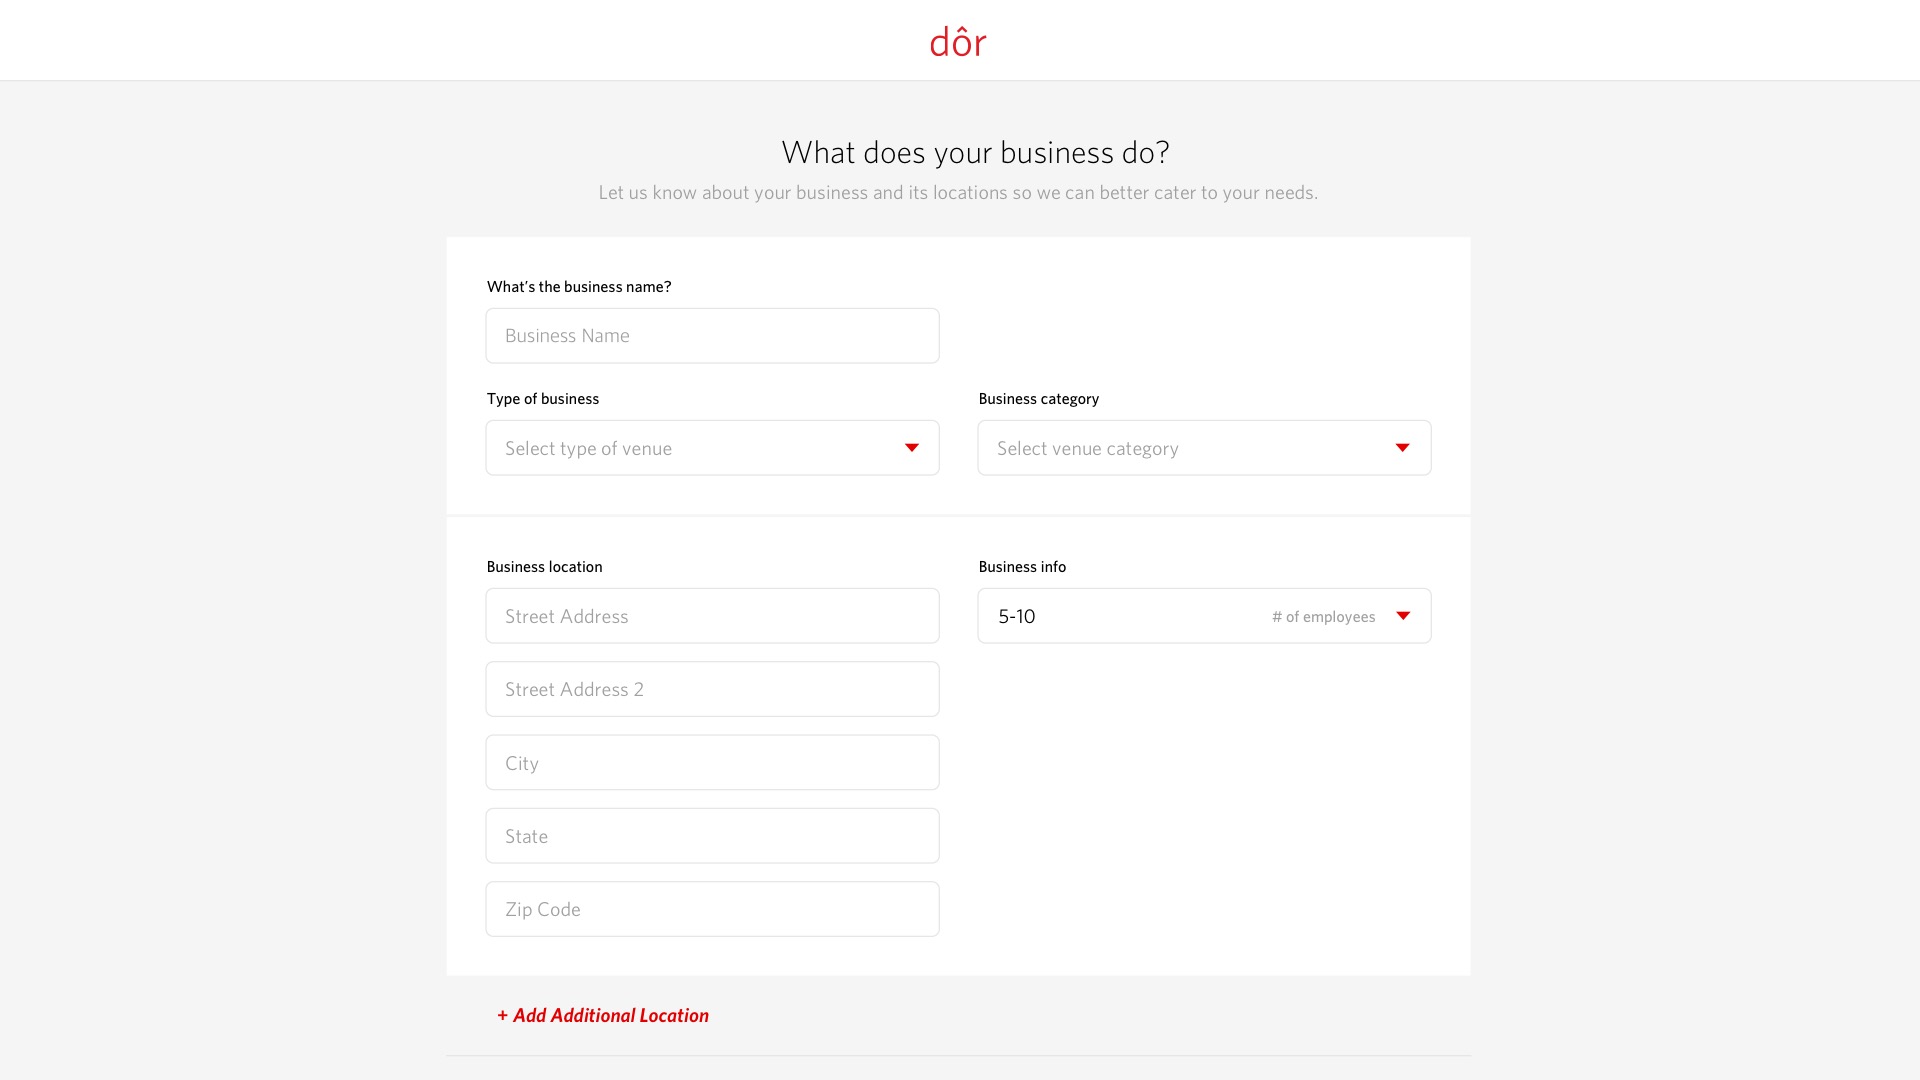
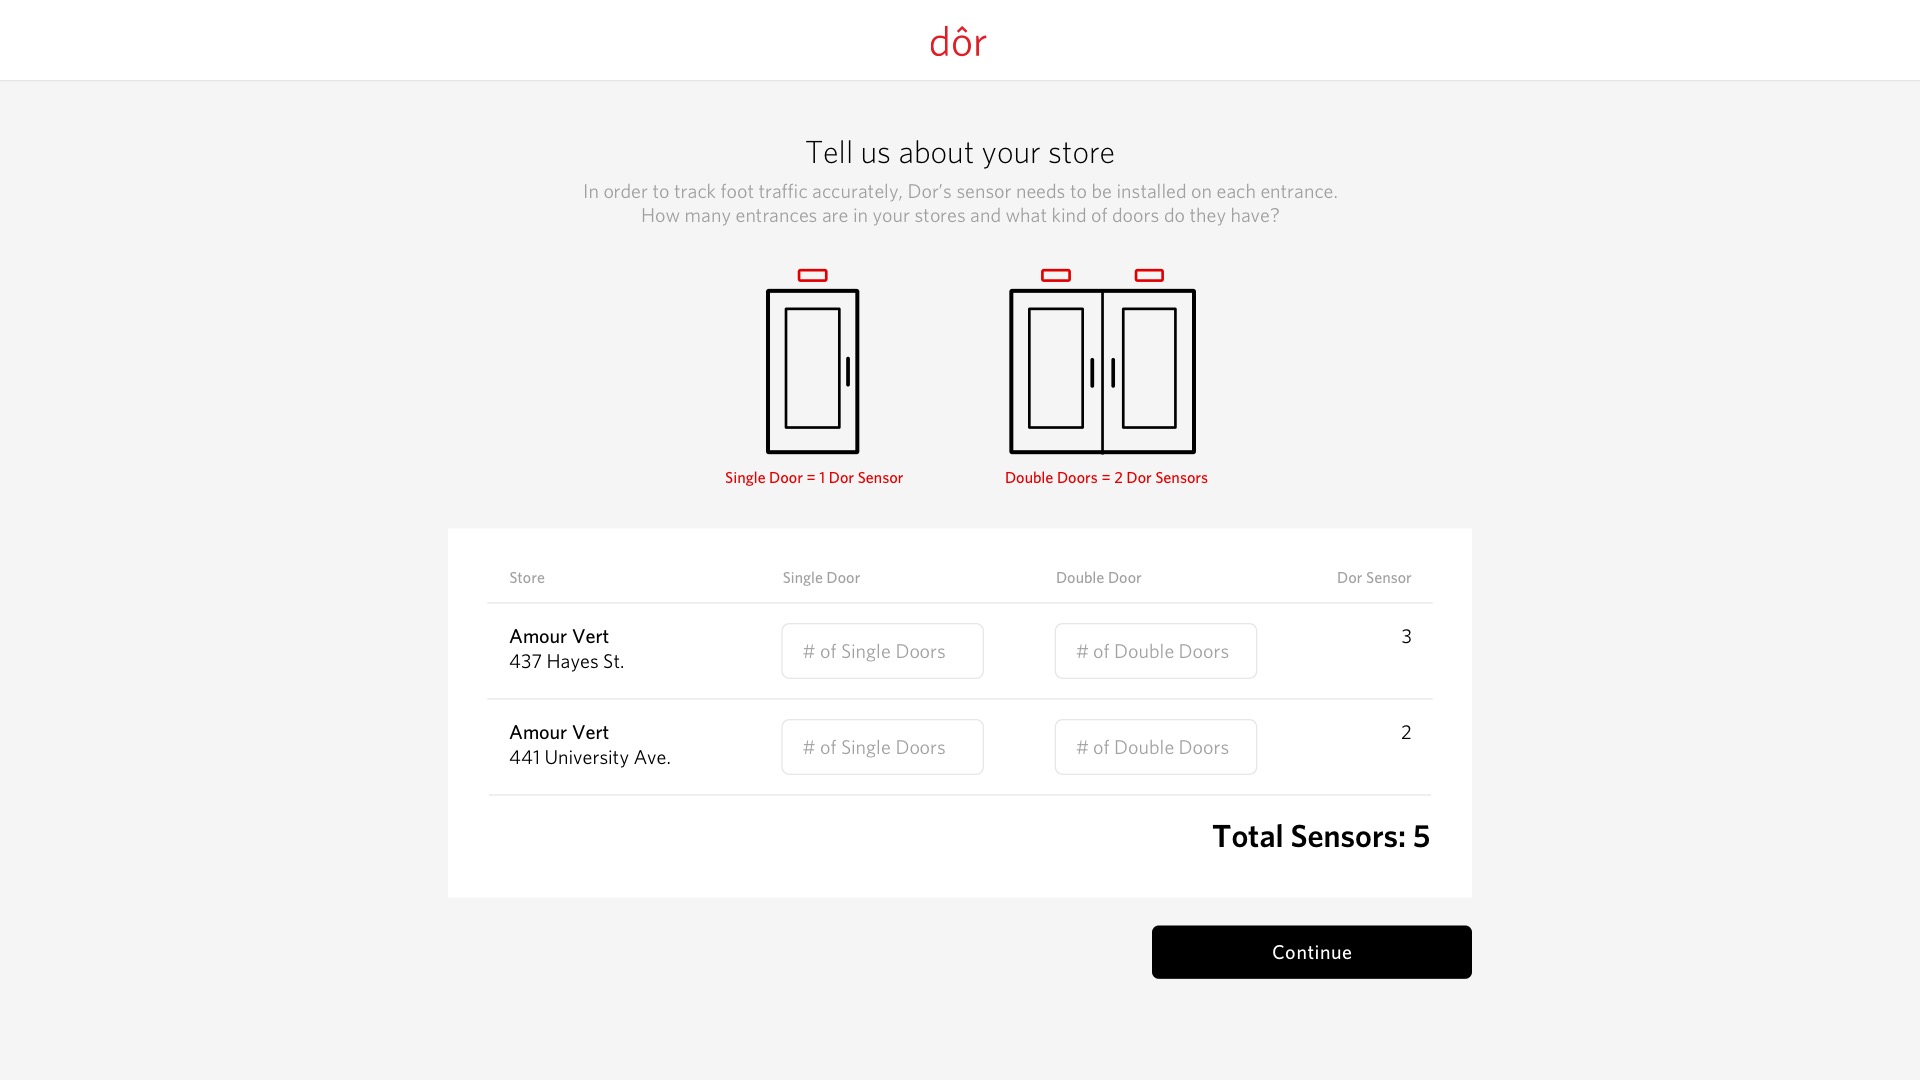
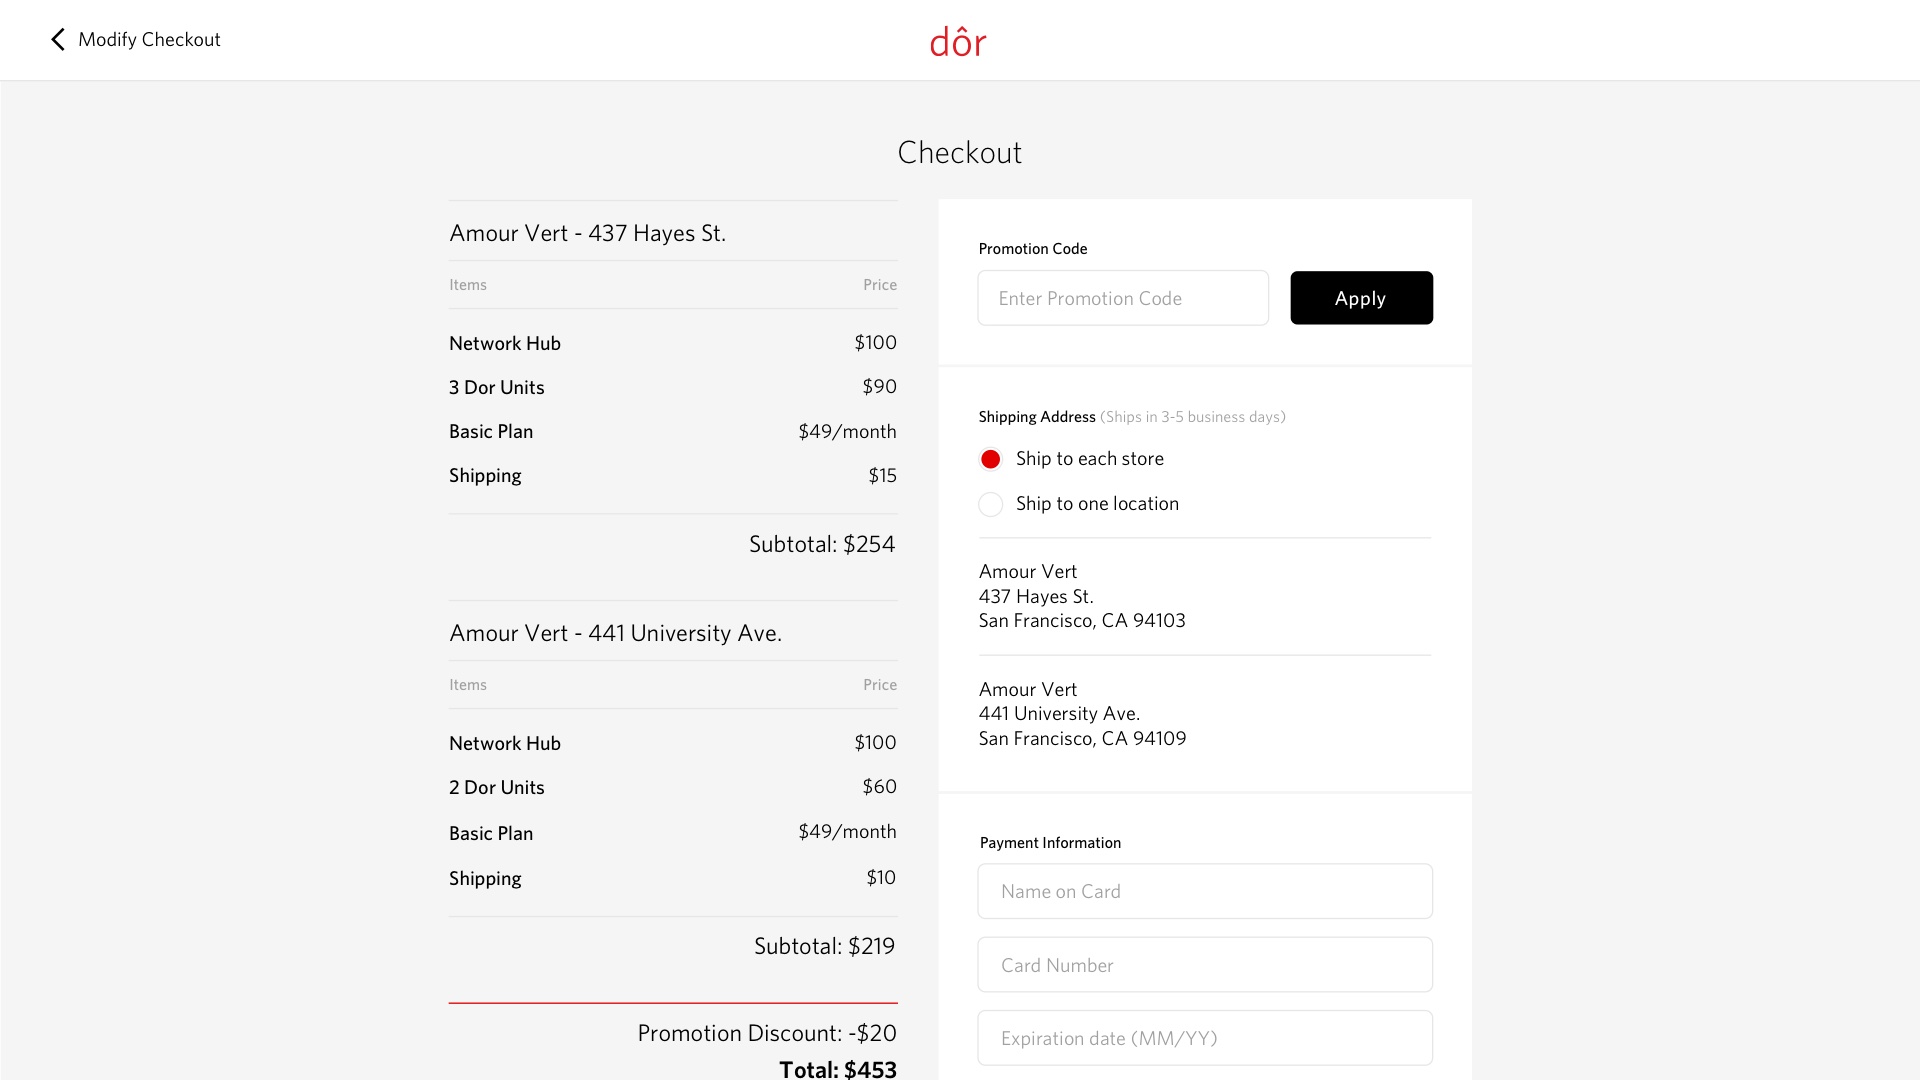
How can Dor simplify the difficult buyer journey for retail analytics?
Solution
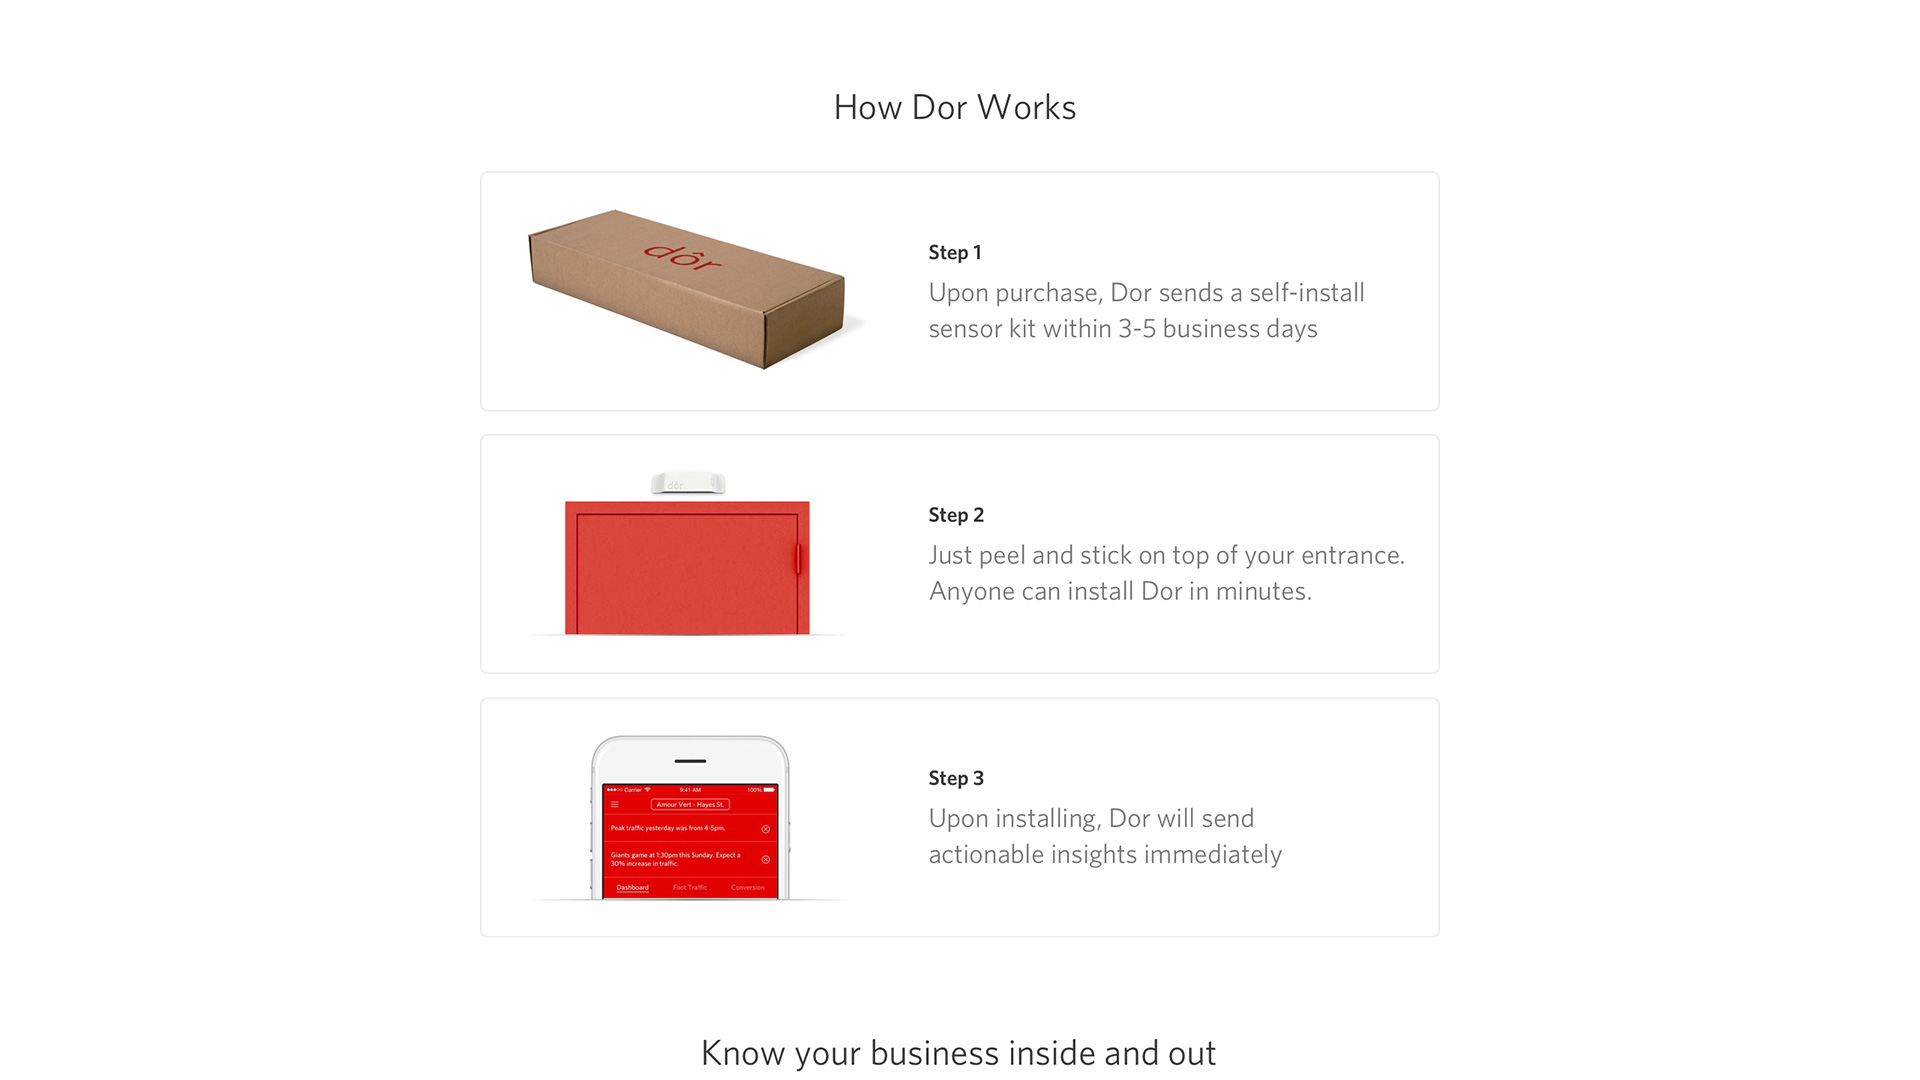
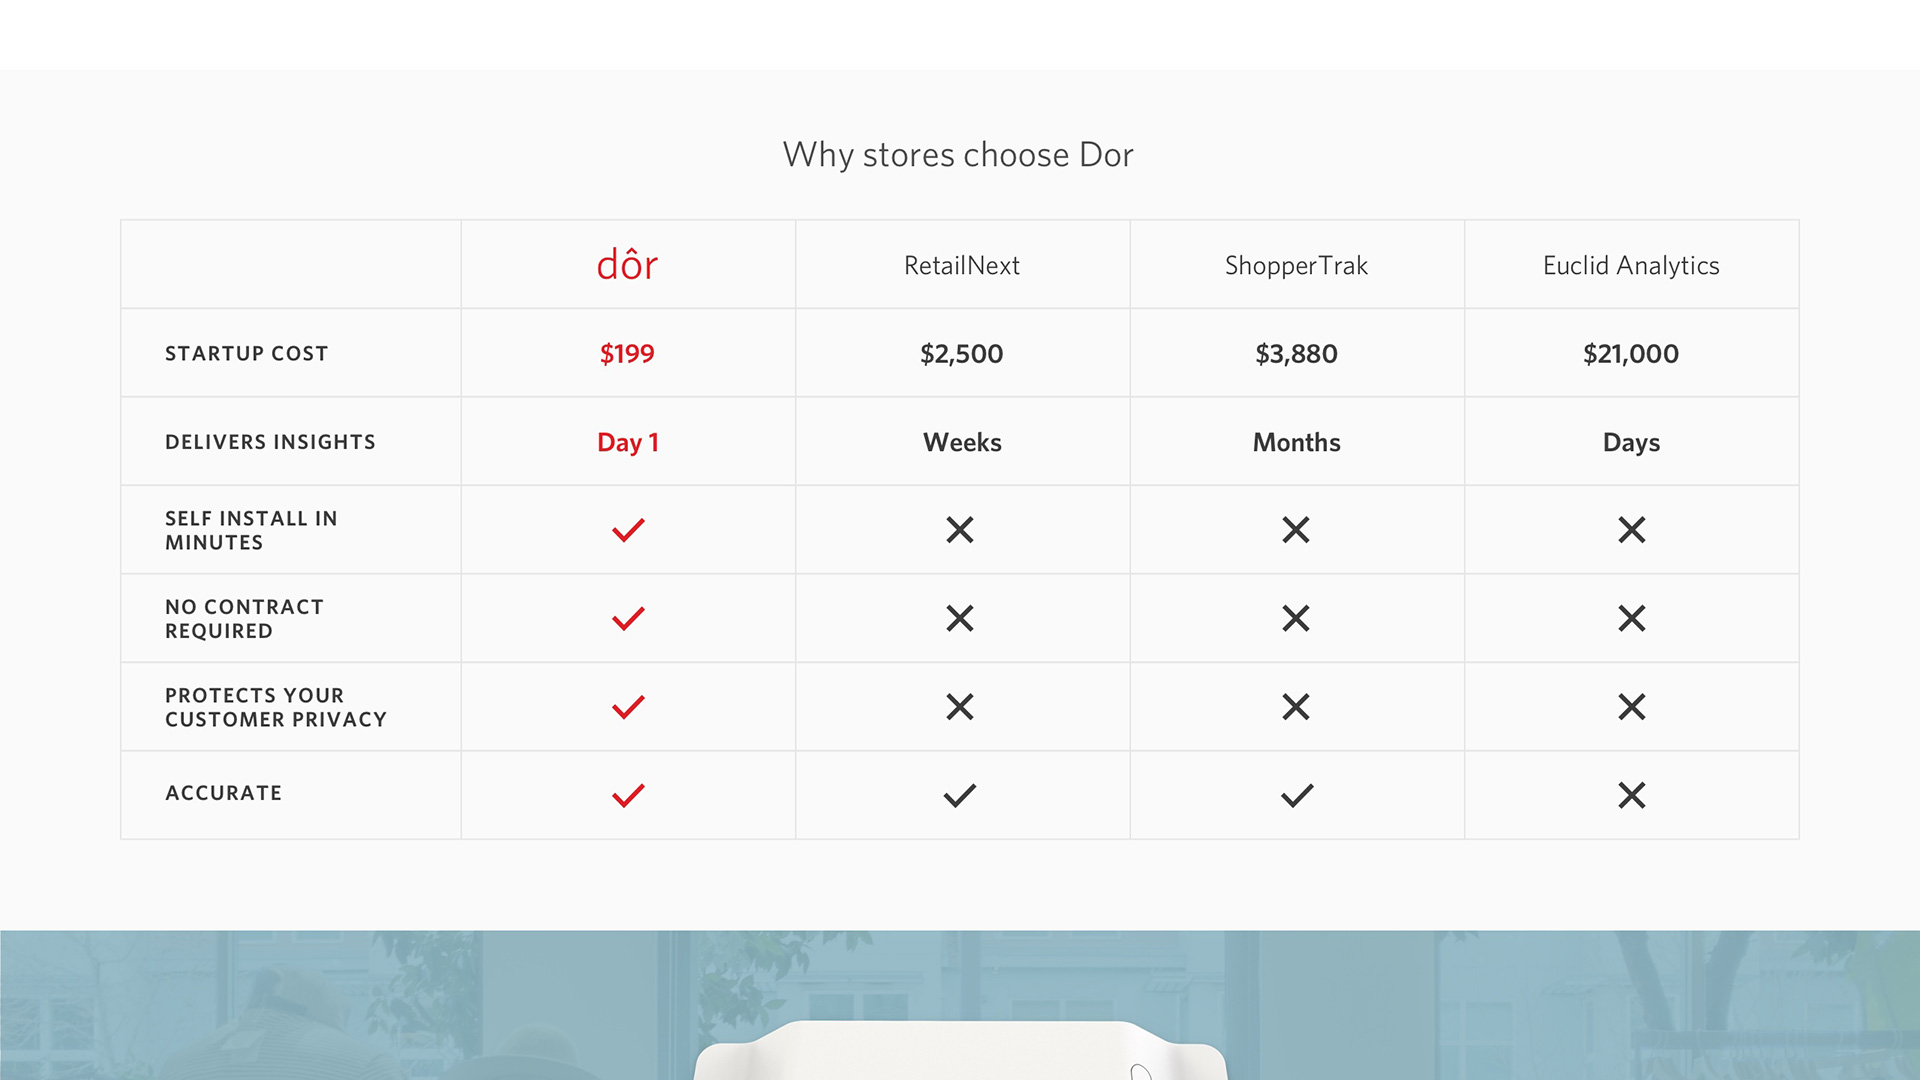
Dor's competitors require purchasing through a sales representative and professionally installing their sensors. Dor streamlines this painful buyer journey by selling its innovative self-install sensor simply on the website.